Friday, August 28, 2009
Wednesday, August 19, 2009
Strong Performance in 2Q by the $1B+ Peer Group
At June, there are 154 credit unions in the "Billion Dollar Club." Callahan's First Look program provides early insight into the performance of the nation’s largest credit unions. These represent roughly 44% of all credit union assets. View the entire list here.
Most of these credit unions (124) saw positive member growth, with Alliant (IL) posting the largest gain of 17.6%, nearly tripling the group's average of 6%. Patelco (16.7%) and SchoolsFirst (14.6%), both in California, come in second and third at success in attracting new members. (While mergers contributed to the growth of some credit unions we have removed credit unions whose mergers were the dominant factor in their annual growth.)
Trumark Financial (PA) led the group in share growth, posting an increase of 35.4%. Right behind was Teachers (NY) with 30.4% and Anheuser-Busch Employees (MO) with 28.9%. The distribution of share growth had greater variation than member growth, as some credit unions pulled back on share promotions to preserve their capital ratio. Beyond increased personal savings rates, Anheuser-Busch Employees saw increased flows due to Anheuser-Busch's sale (and the resulting stock sale) to InBev. Twenty-three credit unions saw a decline in total shares.
The fastest growth on the share side came from IRA/Keoghs (18.2% annual growth) and money market accounts (13.8%). Over 50 of the Billion Dollar Club credit unions now offer Health Savings Accounts (included in the share totals above).
On the lending side, four credit unions grew their loan portfolios by more than 20% for the 12 months ending June 2009:
- Public Service Employees (CO) 25.73%
- Randolph-Brooks (TX) 21.97%
- Teachers (NY) 20.66%
- Chevron (CA) 20.48%
Mortgages were a primary but not exclusive factor in their growth. A diverse strategy across a variety of products, including auto and business loans, propelled these credit unions to the top of this list. The top three credit unions above grew auto loans double digits with Teachers nearly doubling their portfolio from last year.
Record 1st mortgage sales on the secondary market did keep balance sheet loan growth down for some, even as origination volume soared. Bank-Fund Staff (DC) posted an almost two-fold growth in loan originations and is on pace to exceed its record loan originations set in 2003.
Monday, August 3, 2009
First Look Data is ready! A Look at Alpha & Leader Tables
Sorry for the absence--I was waiting for First Look data to continue my custom graphing explanation. OK, OK...that's not true...I just got behind on other things and neglected the blog. I apologize to the Custom Graphing Jedi-in-training. I hope you continued your studies while I was gone.
But, it is true that First Look is ready. I just downloaded the First Look file and now have over 3,000 credit unions to analyze using 2Q data. For you data & analysis nerds out there, now is the time to start raggin' on your colleagues that DON'T use Peer. Light up the CFO listserv with 2Q fun facts that only YOU know, while they struggle to use NCUA.gov to get data. Ok, enough trash talking. Back to Custom Graphing.
Where were we? I've covered all the Single Credit Union or Peer Group charts, as well as the various Historical tables. Let's move on to Lists under both All Comparisons and Detailed. First a quick note about the difference between the two sections.
All Comparisons: By default, these graphs will show data for the primary and any comparisons you have selected. The CUs within those Peer Groups, by default, do NOT show on these charts. However, you can add them simply by selecting "Include all credit unions that comprise the selected comparisons" on the Account Selection screen. In essense, you've just upgraded to the Detailed group of graphs.
Detailed: By default, these graphs will show data for the primary and ALL the CUs that make up the comparisons, but NOT show the comparisons if they are an aggregated Peer Group. You can also add in the Peer Group averages by selecting "Just show selected comparisons" on the Account Selection screen. This is really mislabled in this case and should "Also include selected comparisons". I'll suggest that to the team.
Wow. I'm tired just writing that. Ok, on to the custom graphs. Alpha & Leader Tables.
Basically the same thing, but one sorts the data alphabetically by default; the other sorts by the first account code, highest to lowest, to create a ranking report. Pretty straightforward. In addition to the difference listed above (All Comparisons v. Detailed), you can always click on any column header to sort the data by that row. So, for accounts where LOWER is better (delinquency, efficiency etc.), just click that column header to reverse the listing.
Sunday, August 2, 2009
Downloading First Look Data
First, check for software updates (Under Tools, or the program will just prompt you with that crazy bouncing window in the corner). You need to be on version 2.0.5.7 (don't know what version you have installed? Go to Help --> About Peer to Peer 2.0 --> ) If it's been a while since you've updated, you might need to take a break and go eat lunch while the scripts load. The software team has been busy with upgrades and fixes, so depending on the last time you used Peer, you might have to wait a bit (but before you complain, it's a lot less waiting than when we used to send disks in the mail!)
Now that you're ready for First Look data, go to File --> Import --> First Look Data. Follow the prompts and you're done! That was easy. Reminder: The First Look file is not the complete 5300 (it's about 90% of it). So, every once in a while, you may click on a graph or table and get a message that says "this data is not available in the First Look data file" (ex. the CUSO investments schedule).
You'll now see First Look 2Q on the cycle pull down menu. Three things to note:
1. If you want your primary to be a CU that isn't in the First Look file, you need to "cycle back" to 1Q before you go to select them on the Primary/Comparisons screen. Why would you do this? Well, for me, I still need to look up credit unions that may not yet be loaded for other reasons that evaluating 2Q performance.
2. If you get a weird "there is no data at row 0" message, cycle back to 1Q and click around on some graphs. Then go back to 2Q data and all should be fine. No one I have talked got this error, but I did on my laptop at home. Might as well give you a workaround if you're in the 1% like me that got this weird error.
3. Check back soon...as I type this, more CUs are being processed for the next load.
Monday, July 27, 2009
Success!! NCUA re-releases 4Q data
Chip Filson wrote on CreditUnionsRising.com "The incoming NCUA Chair faces many challenges. Restoring financial integrity to the call report process is an immediate one. In a dramatically increased uncertain world, the new Chair can be sure of two things: first, losses and therefore asset values, will be hard to estimate for quite some time; and second, capturing these elusive values thru the call report process will continue to be problematic.
New approaches and better action steps to handle both valuation and accounting treatment of loss estimates are needed. To date, NCUA has handled neither well. There will, however, be opportunities to improve the current situation and define new approaches in the months ahead.
The immediate issue is understanding how the uncertainty and muddied waters now surrounding the call reports occurred."
We submitted a FOIA request to NCUA to re-release the data and almost 100 peer-users supported this effort by emailing NCUA their support of this effort. Now, the first step has been taken. NCUA has re-released 4Q data with all of the refiled reports. The software is preparing this data file for use in Peer so you can also have access to the complete data. More information to be sent later this week.
Tomorrow...back to custom graphing!
Thursday, July 23, 2009
New Deposit Analysis CRC available
I'm back! Just returned from overseas so am getting caught up on everything. Here's a quick post about a new CRC file available for Peer Users on deposit analysis.
A colleague of mine, Dane Coalson, hosted an event on analyzing deposits. I regret to say I missed it (was overseas) and if you did too, you can still watch the recording on CUtv. Click here.
Password: Deposits507
Dane also posted a CRC file with 11 graphs from this event. You can get it on www.p2psoftware.com under Resources. Or click here.
You can read more on CreditUnions.com in his article Using the Power of Data to Identify Trends and Opportunities in the Share Portfolio
Tuesday, July 21, 2009
Custom Graphing: Historical Charts (love these...)
While you toil away at your Jedi training, I am (probably) enjoying a view of the Swiss Alps. At least that's the plan. I'll let you know the reality when I'm back State-side on Thursday.
Ok, today's lesson: History tables. There are two...and a great way to access data that you can export to excel to manipulate (for good....not evil...keep repeating.) I demonstrate a way to use this report to calculate quarterly values for accounts reported YTD in a previous blog post.
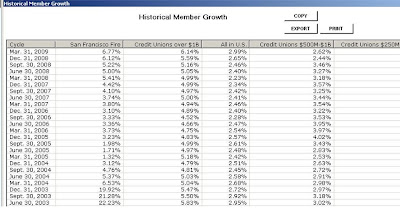
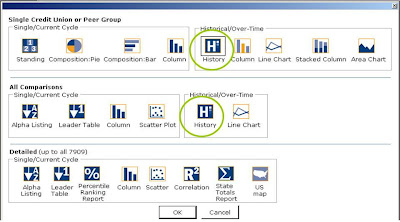 With the first option, Single CU/PG History, you create a table of values for multiple accounts for a single entity over time.
 The second option, All Comparisons History, creates a grid of historical values for a single account for all your comparisons. WARNING: Do NOT select "Include all comparisons that comprise the selected comparisons" on the Account Selection screen unless you have a SMALL peer group selected or PLENTY of time to let Peer run. (I don't think the original specifications even meant for that option to be available ... )
 Why would you use this? Couple reasons I can think of...As I said in a previous blog post, Peer can do a lot but sometimes you need to put data in Excel to create a specific graph. This report allows for a quick pull and export.
I use this report a lot to spot data inconsistencies. Example: I was helping a client pull data on mortgage sales on the secondary. There was a huge bump in one quarter so I pulled an All Comparisons Historical report to see the underlying data. Found that one CU had reported their YTD sales incorrectly back in 2003 by adding an extra zero (I verified against NCUA's report--it's still wrong there too).
How do you use these reports? Would love your feedback. Please comment.
Ok, today's lesson: History tables. There are two...and a great way to access data that you can export to excel to manipulate (for good....not evil...keep repeating.) I demonstrate a way to use this report to calculate quarterly values for accounts reported YTD in a previous blog post.
 With the first option, Single CU/PG History, you create a table of values for multiple accounts for a single entity over time.
 The second option, All Comparisons History, creates a grid of historical values for a single account for all your comparisons. WARNING: Do NOT select "Include all comparisons that comprise the selected comparisons" on the Account Selection screen unless you have a SMALL peer group selected or PLENTY of time to let Peer run. (I don't think the original specifications even meant for that option to be available ... )
 Why would you use this? Couple reasons I can think of...As I said in a previous blog post, Peer can do a lot but sometimes you need to put data in Excel to create a specific graph. This report allows for a quick pull and export.
I use this report a lot to spot data inconsistencies. Example: I was helping a client pull data on mortgage sales on the secondary. There was a huge bump in one quarter so I pulled an All Comparisons Historical report to see the underlying data. Found that one CU had reported their YTD sales incorrectly back in 2003 by adding an extra zero (I verified against NCUA's report--it's still wrong there too).
How do you use these reports? Would love your feedback. Please comment.
Subscribe to:
Posts (Atom)

